Guide 05
Charts & distributions
Compare trends without losing the selected dataset scope.
Read the trend with its units
Open Graphics & Distribution after importing a session. Review the current filters and sample count before comparing charts. Use hover tooltips to inspect recorded values rather than estimating them from the line alone.
Compare RSRP, RSRQ and SNR alongside throughput. They do not share a unit or axis scale. Gaps may reflect missing measurements, and a recorded zero throughput can indicate an idle test rather than a proven network failure.
Interface walkthrough
Read trends and distributions
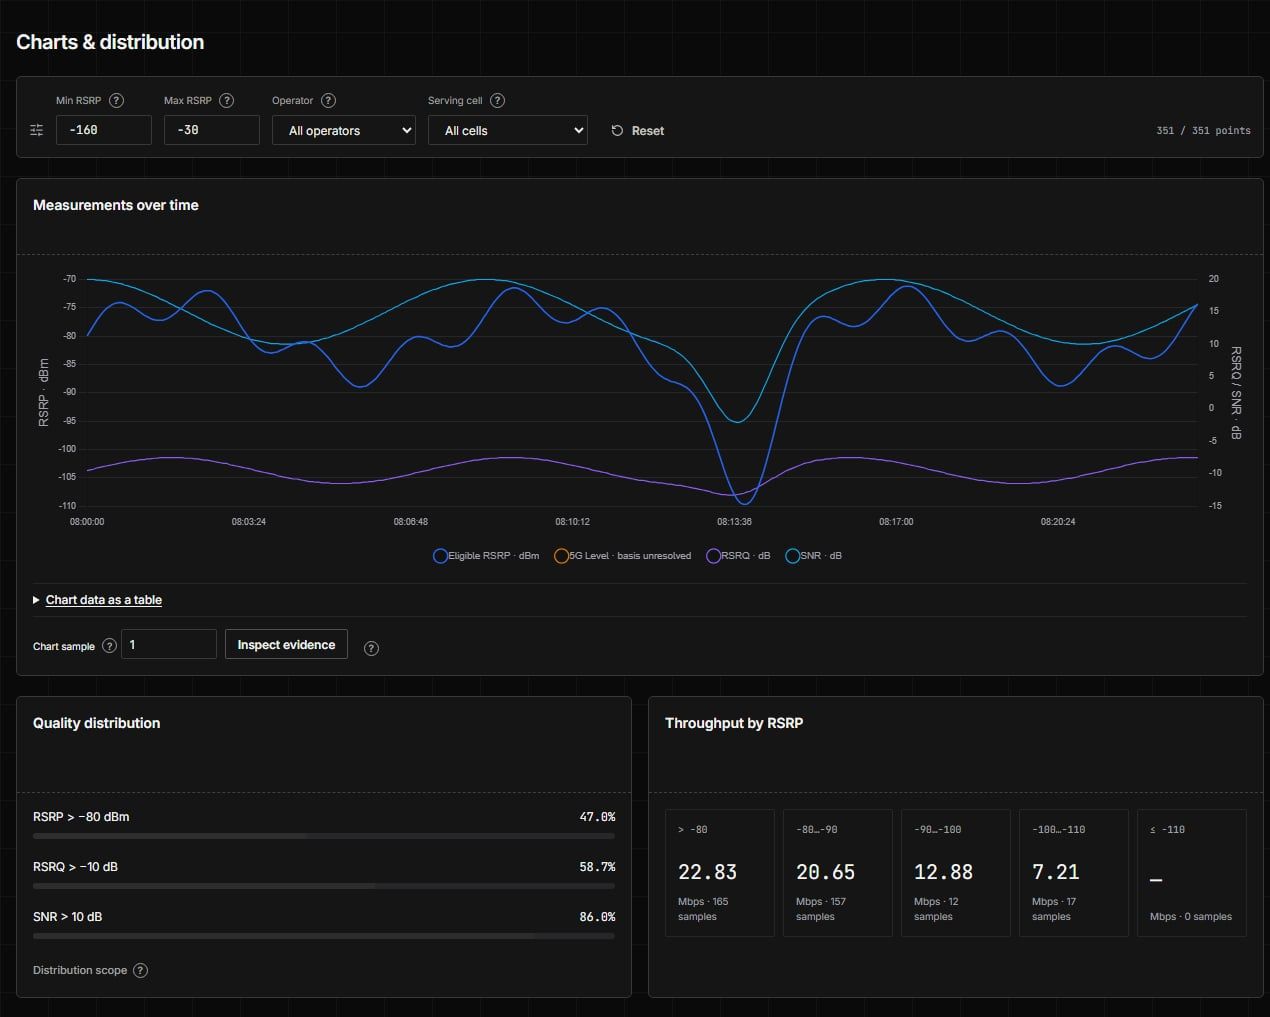
Review filters and sample counts before comparing trends. Keep the same route and logging/test conditions when comparing sessions.
Read distributions as sample evidence
A histogram or quality-band percentage describes available samples within the chosen scope. It is not a geographic area percentage or a population-coverage claim. Repeated points and uneven sampling can bias the distribution.
Compare two exports only after matching technology, measurement unit, route, sampling policy and test activity. Record excluded rows and missing-value counts.
Select a chart sample
Click a measurement trace to inspect the corresponding original sample. For keyboard use, enter a one-based Chart sample number and choose Inspect evidence. The evidence inspector can send that selection to Cici with Ask Cici.
Large charts show decimated points, but a plotted point still maps to its original sample ID. Use Cici Sample window for an inclusive range, not a claim that every location between sparse samples was measured.